Table
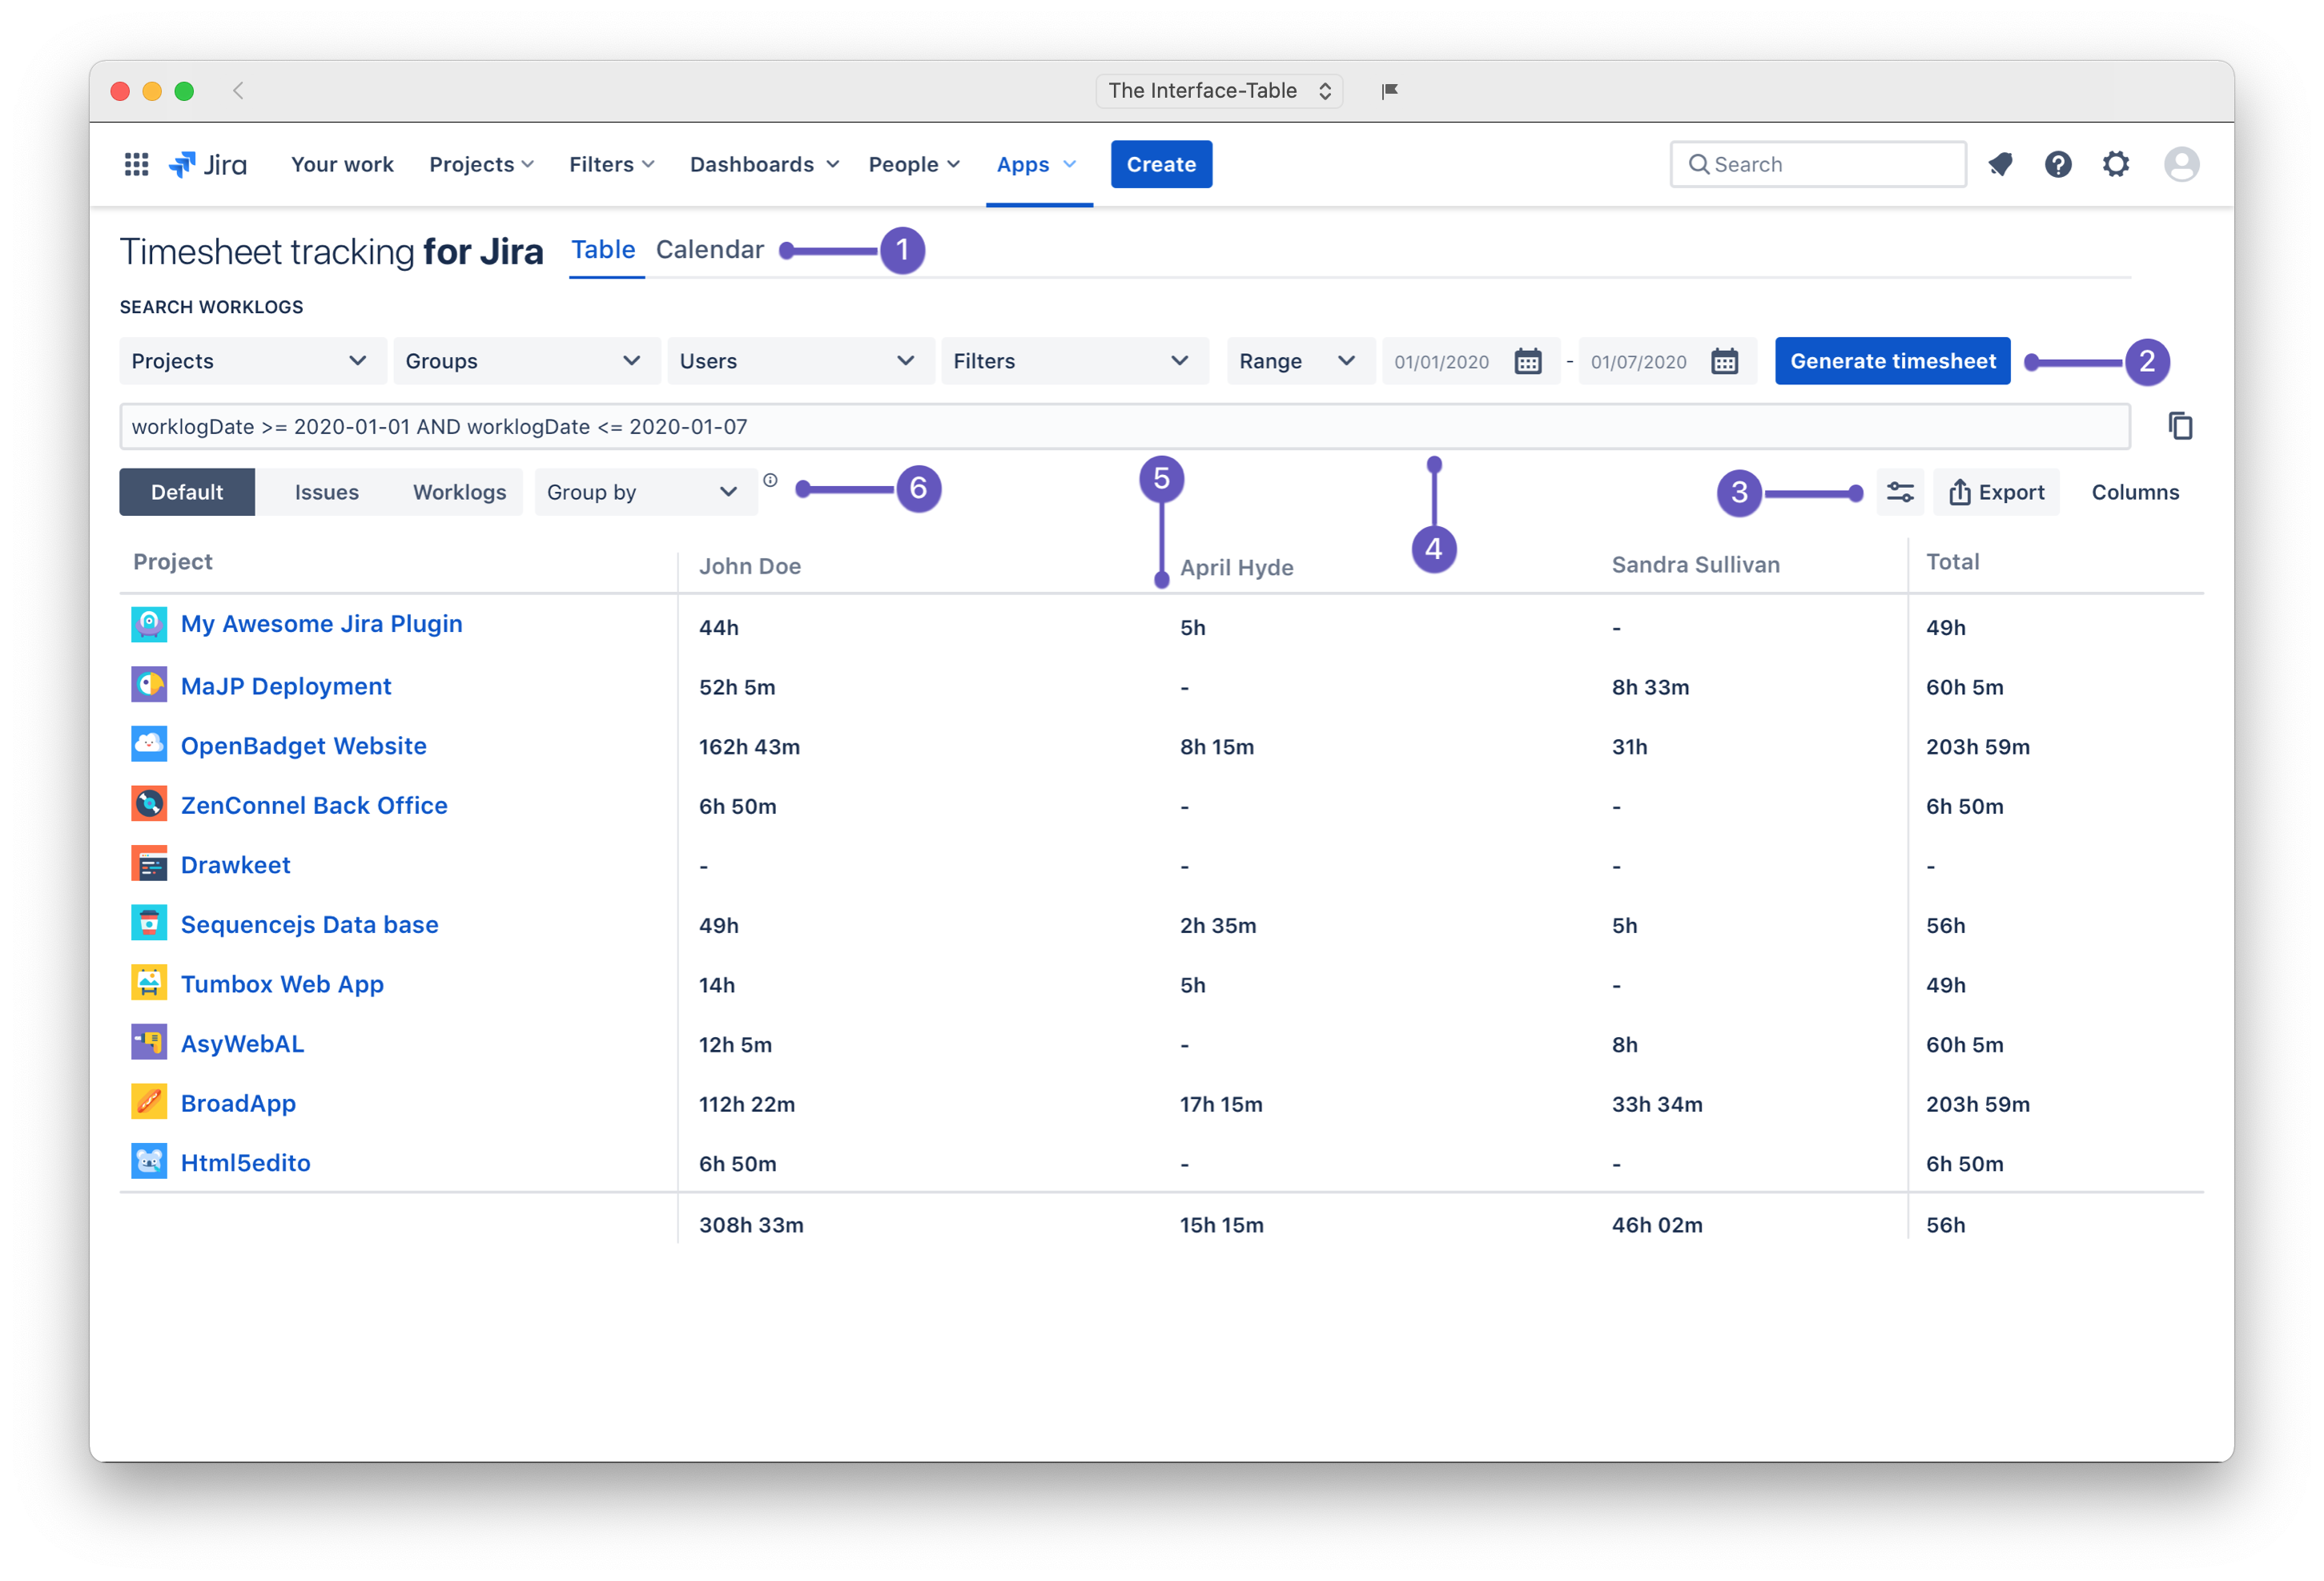
Navigation tab: Quick and easy navigation throught table timesheet and calendar view.
Main Filter: To generate the timesheet, use the main filter (Projects, Groups, Users…etc) then click on “Generate timesheet”.
Display preferences & Actions:
On click, use the options that appear to choose which layout/display options you’re happy with (show/hide; JQL, charts …etc).
Export & download the generated timesheet to a CSV file.
Choose the columns to display in the timesheet table, they will add to to the select “group by”.
4. Filter JQL: Values selected in the filter are translated to a JQL that you can copy/paste and use it to simplify your work.
5. Data table: By simple filtering (using the main filter), you can generate table and get a quick look to your people worklogs or projects duration.
6. Table actions: Allow you to select how the data appears in the data table (By Default/by issues, by worklogs) and Group by various columns previously selected in the display preferences & actions.
Charts
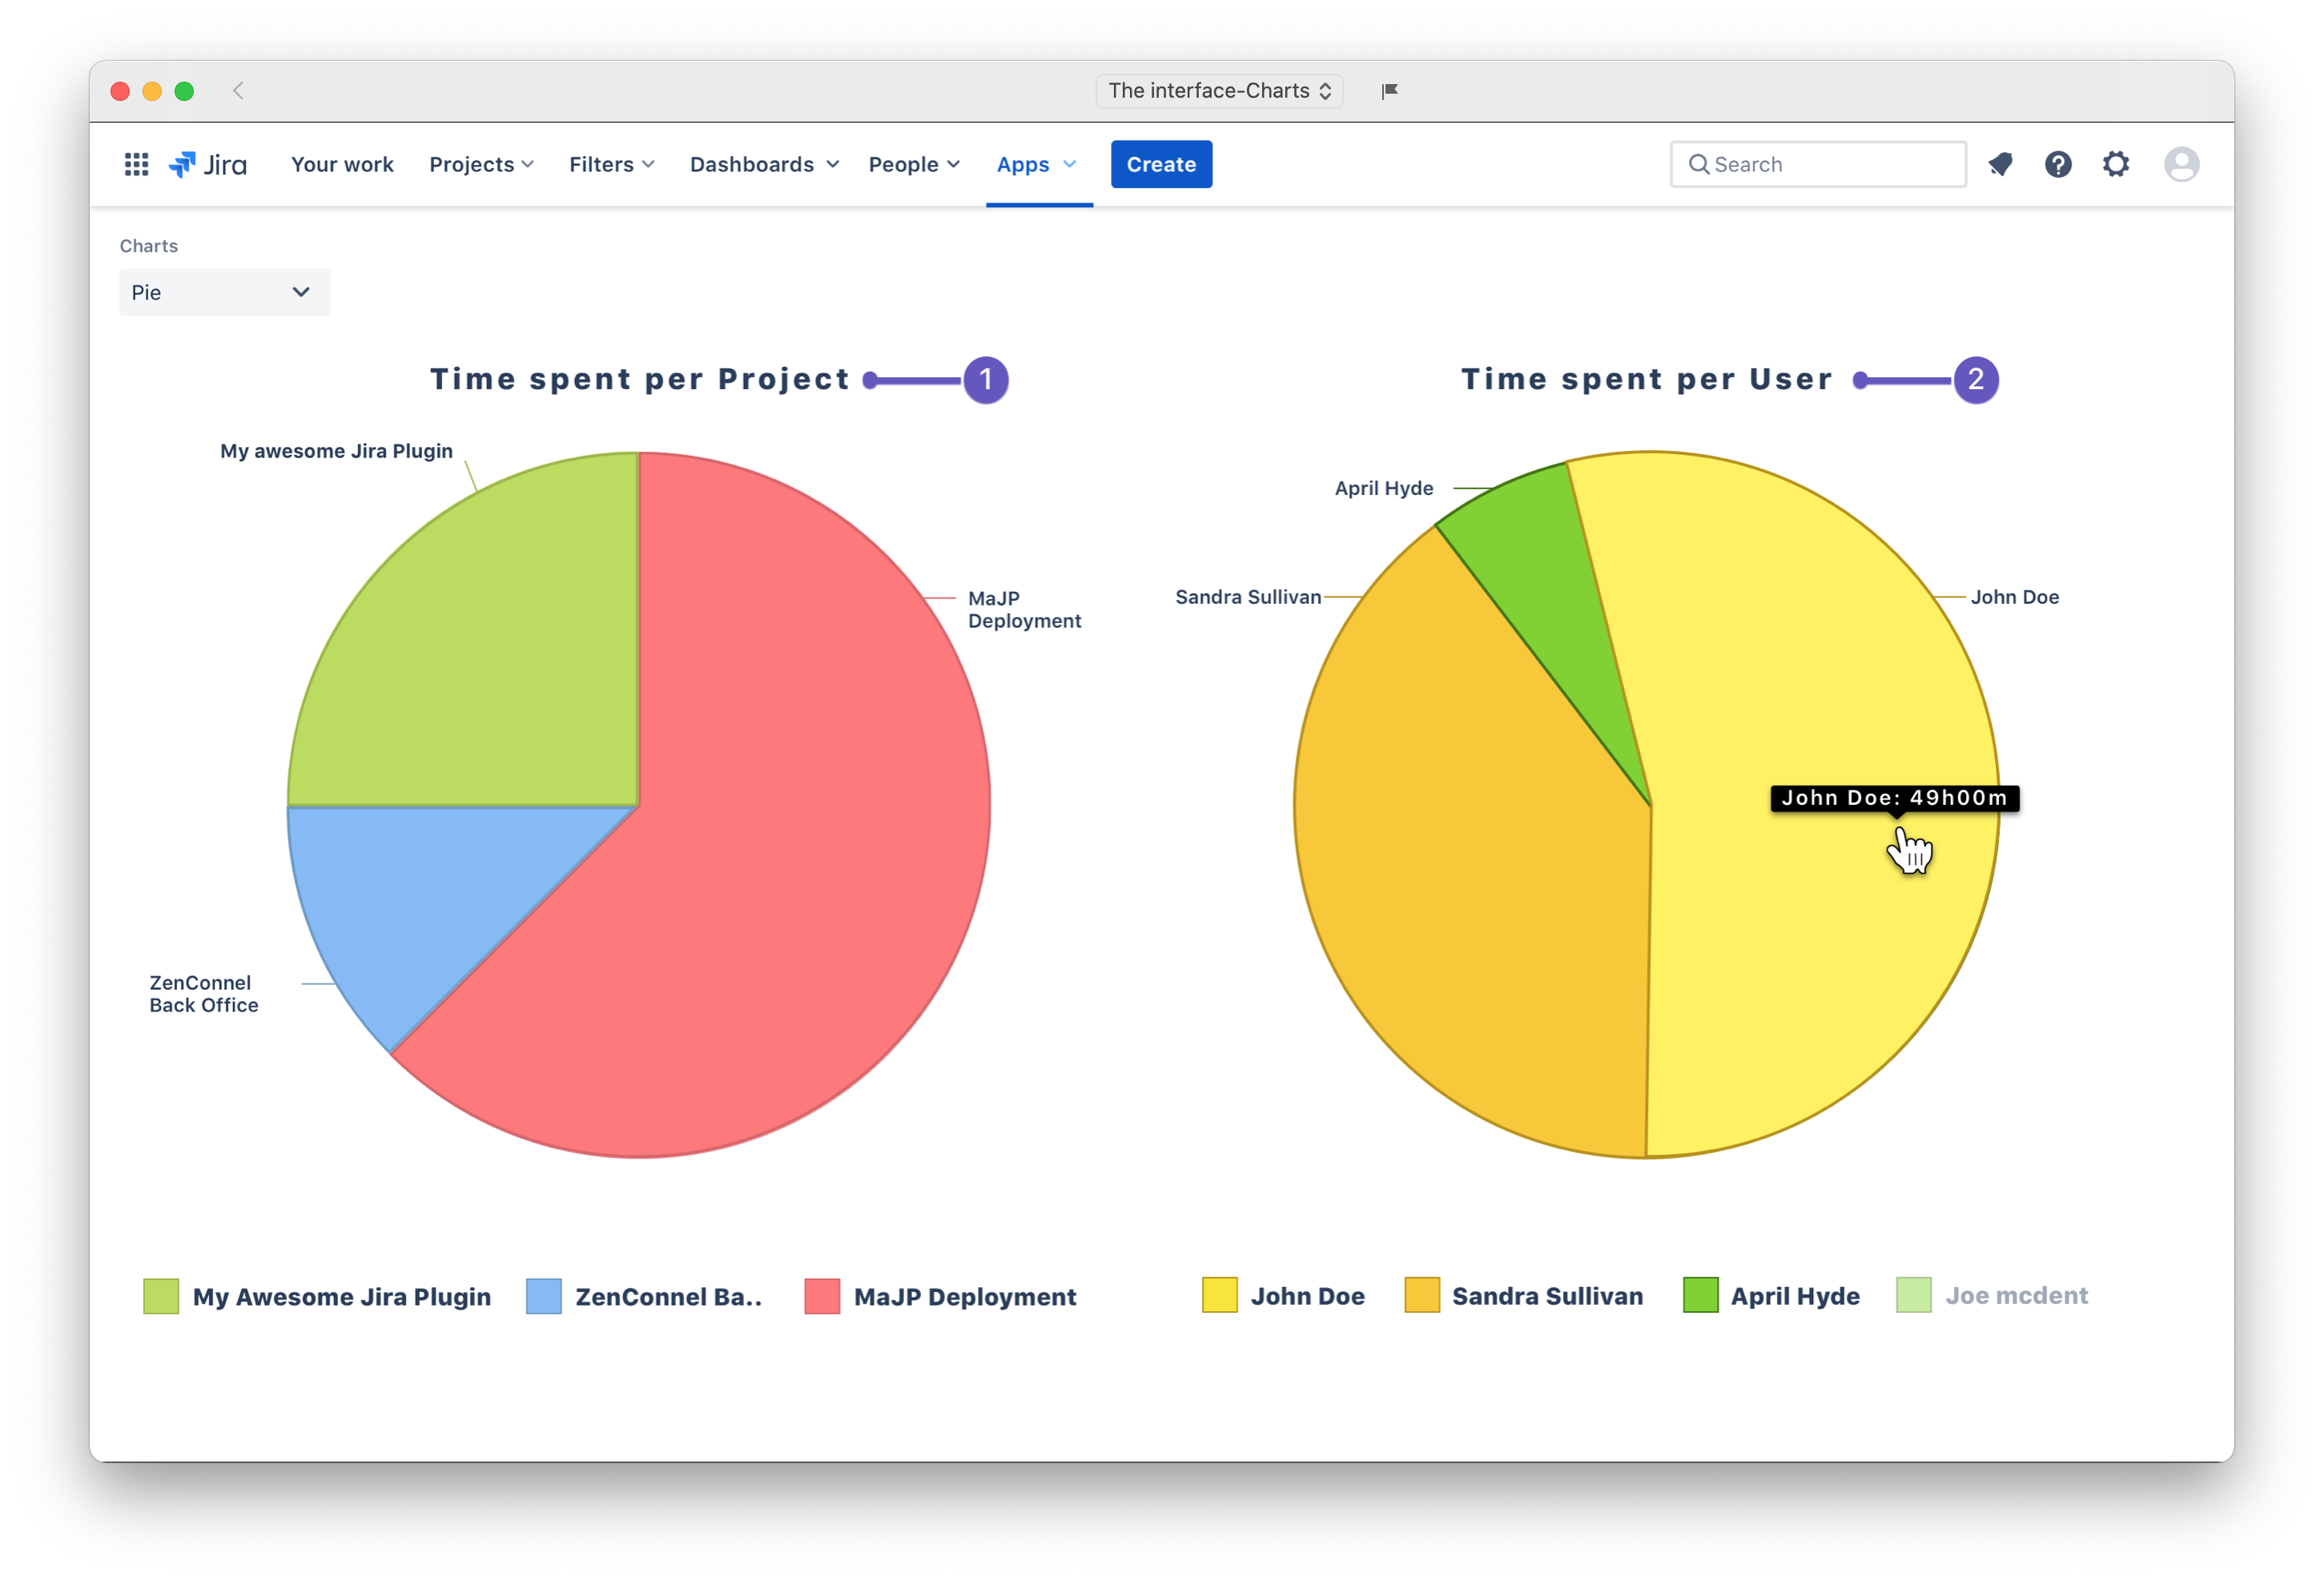
When you choose to display the charts “3. Display preferences & actions”, a dynamic charts will show in the vicinity of the data table below:
Pie chart: Shows the time spent per user selected in the main filter.
Pie chart: Shows the total time spent per every project selected in the main filter.
Calendar
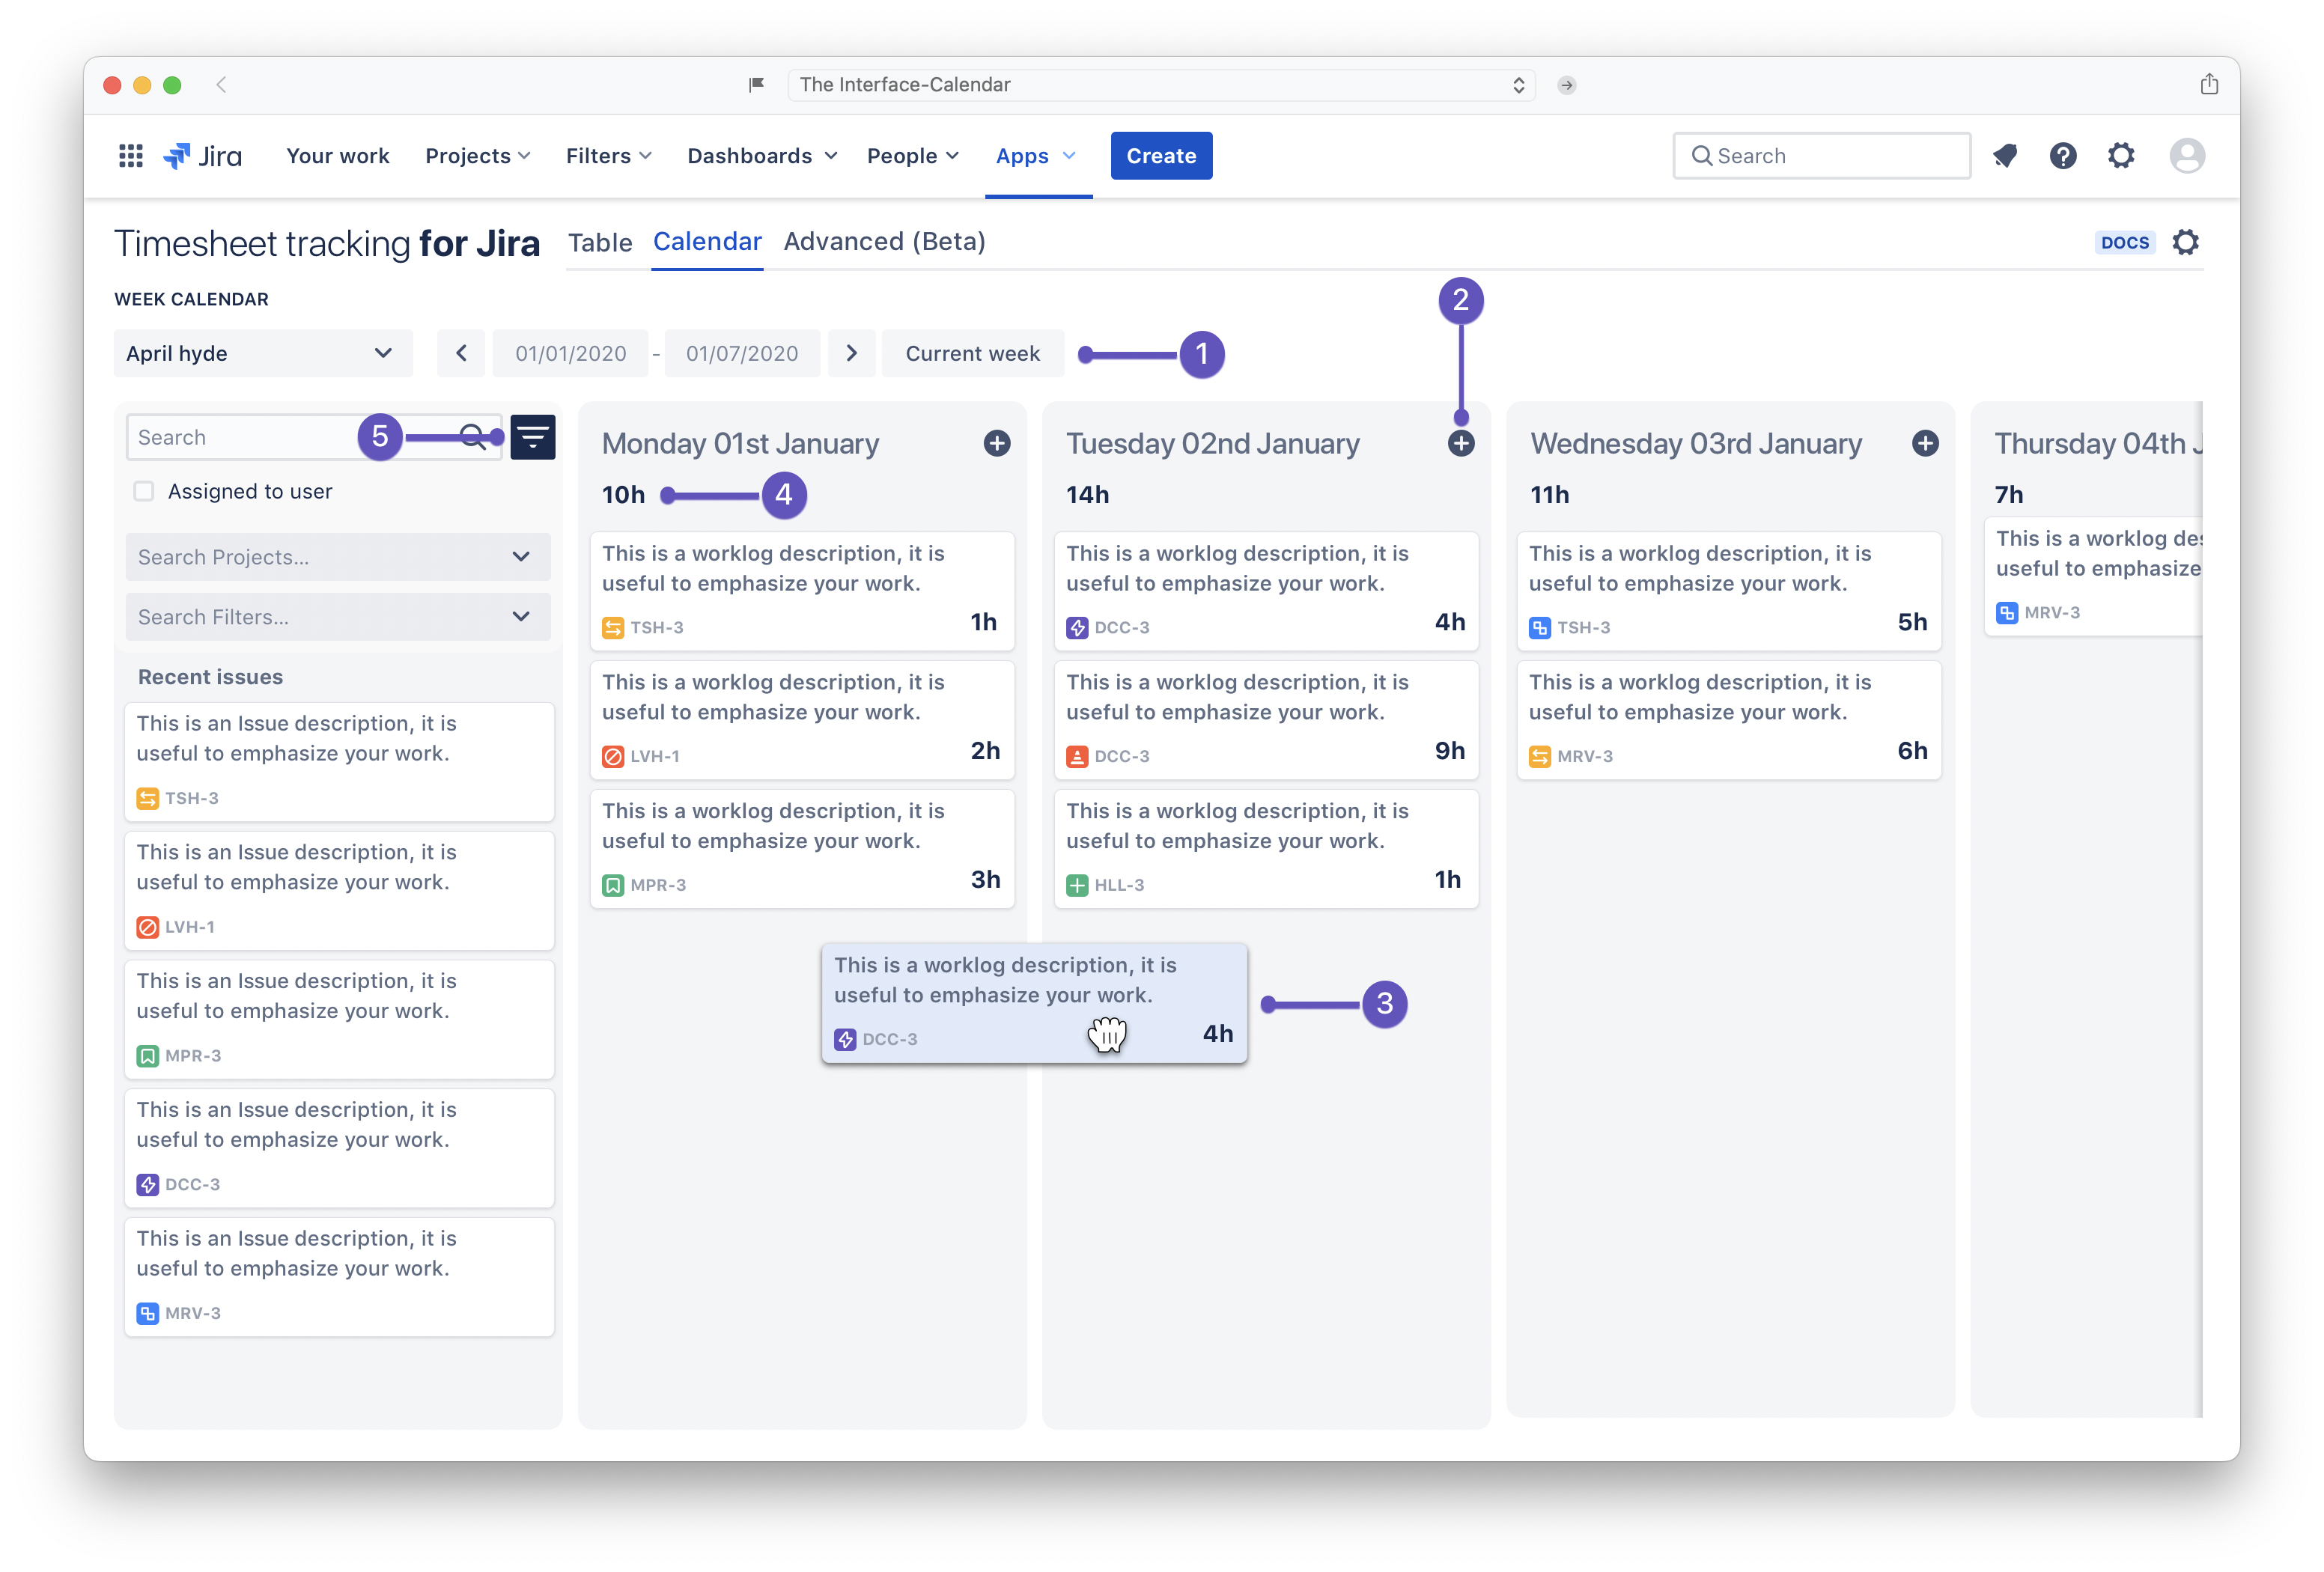
Calendar toolbar: Allows you to select the user, set the date range by using a date picker or click the “Current week” button to take you directly to the current week.
Add a worklog card: By clicking the button, you can quickly add a worklog in a given date you choose in the calendar.
Worklog card: In calendar, worklogs are displayed in the form of cards (You can drag & drop them from a column to another) that contain various info related to the worklog (Worklog description, total worklog time spent and the issue type). By clicking on the card, you can edit the worklog (Edit the time spent, edit the description…etc).
Total time spent: Shows the total time spent of all the different worklogs of that day.
Advanced search:
Add worklog
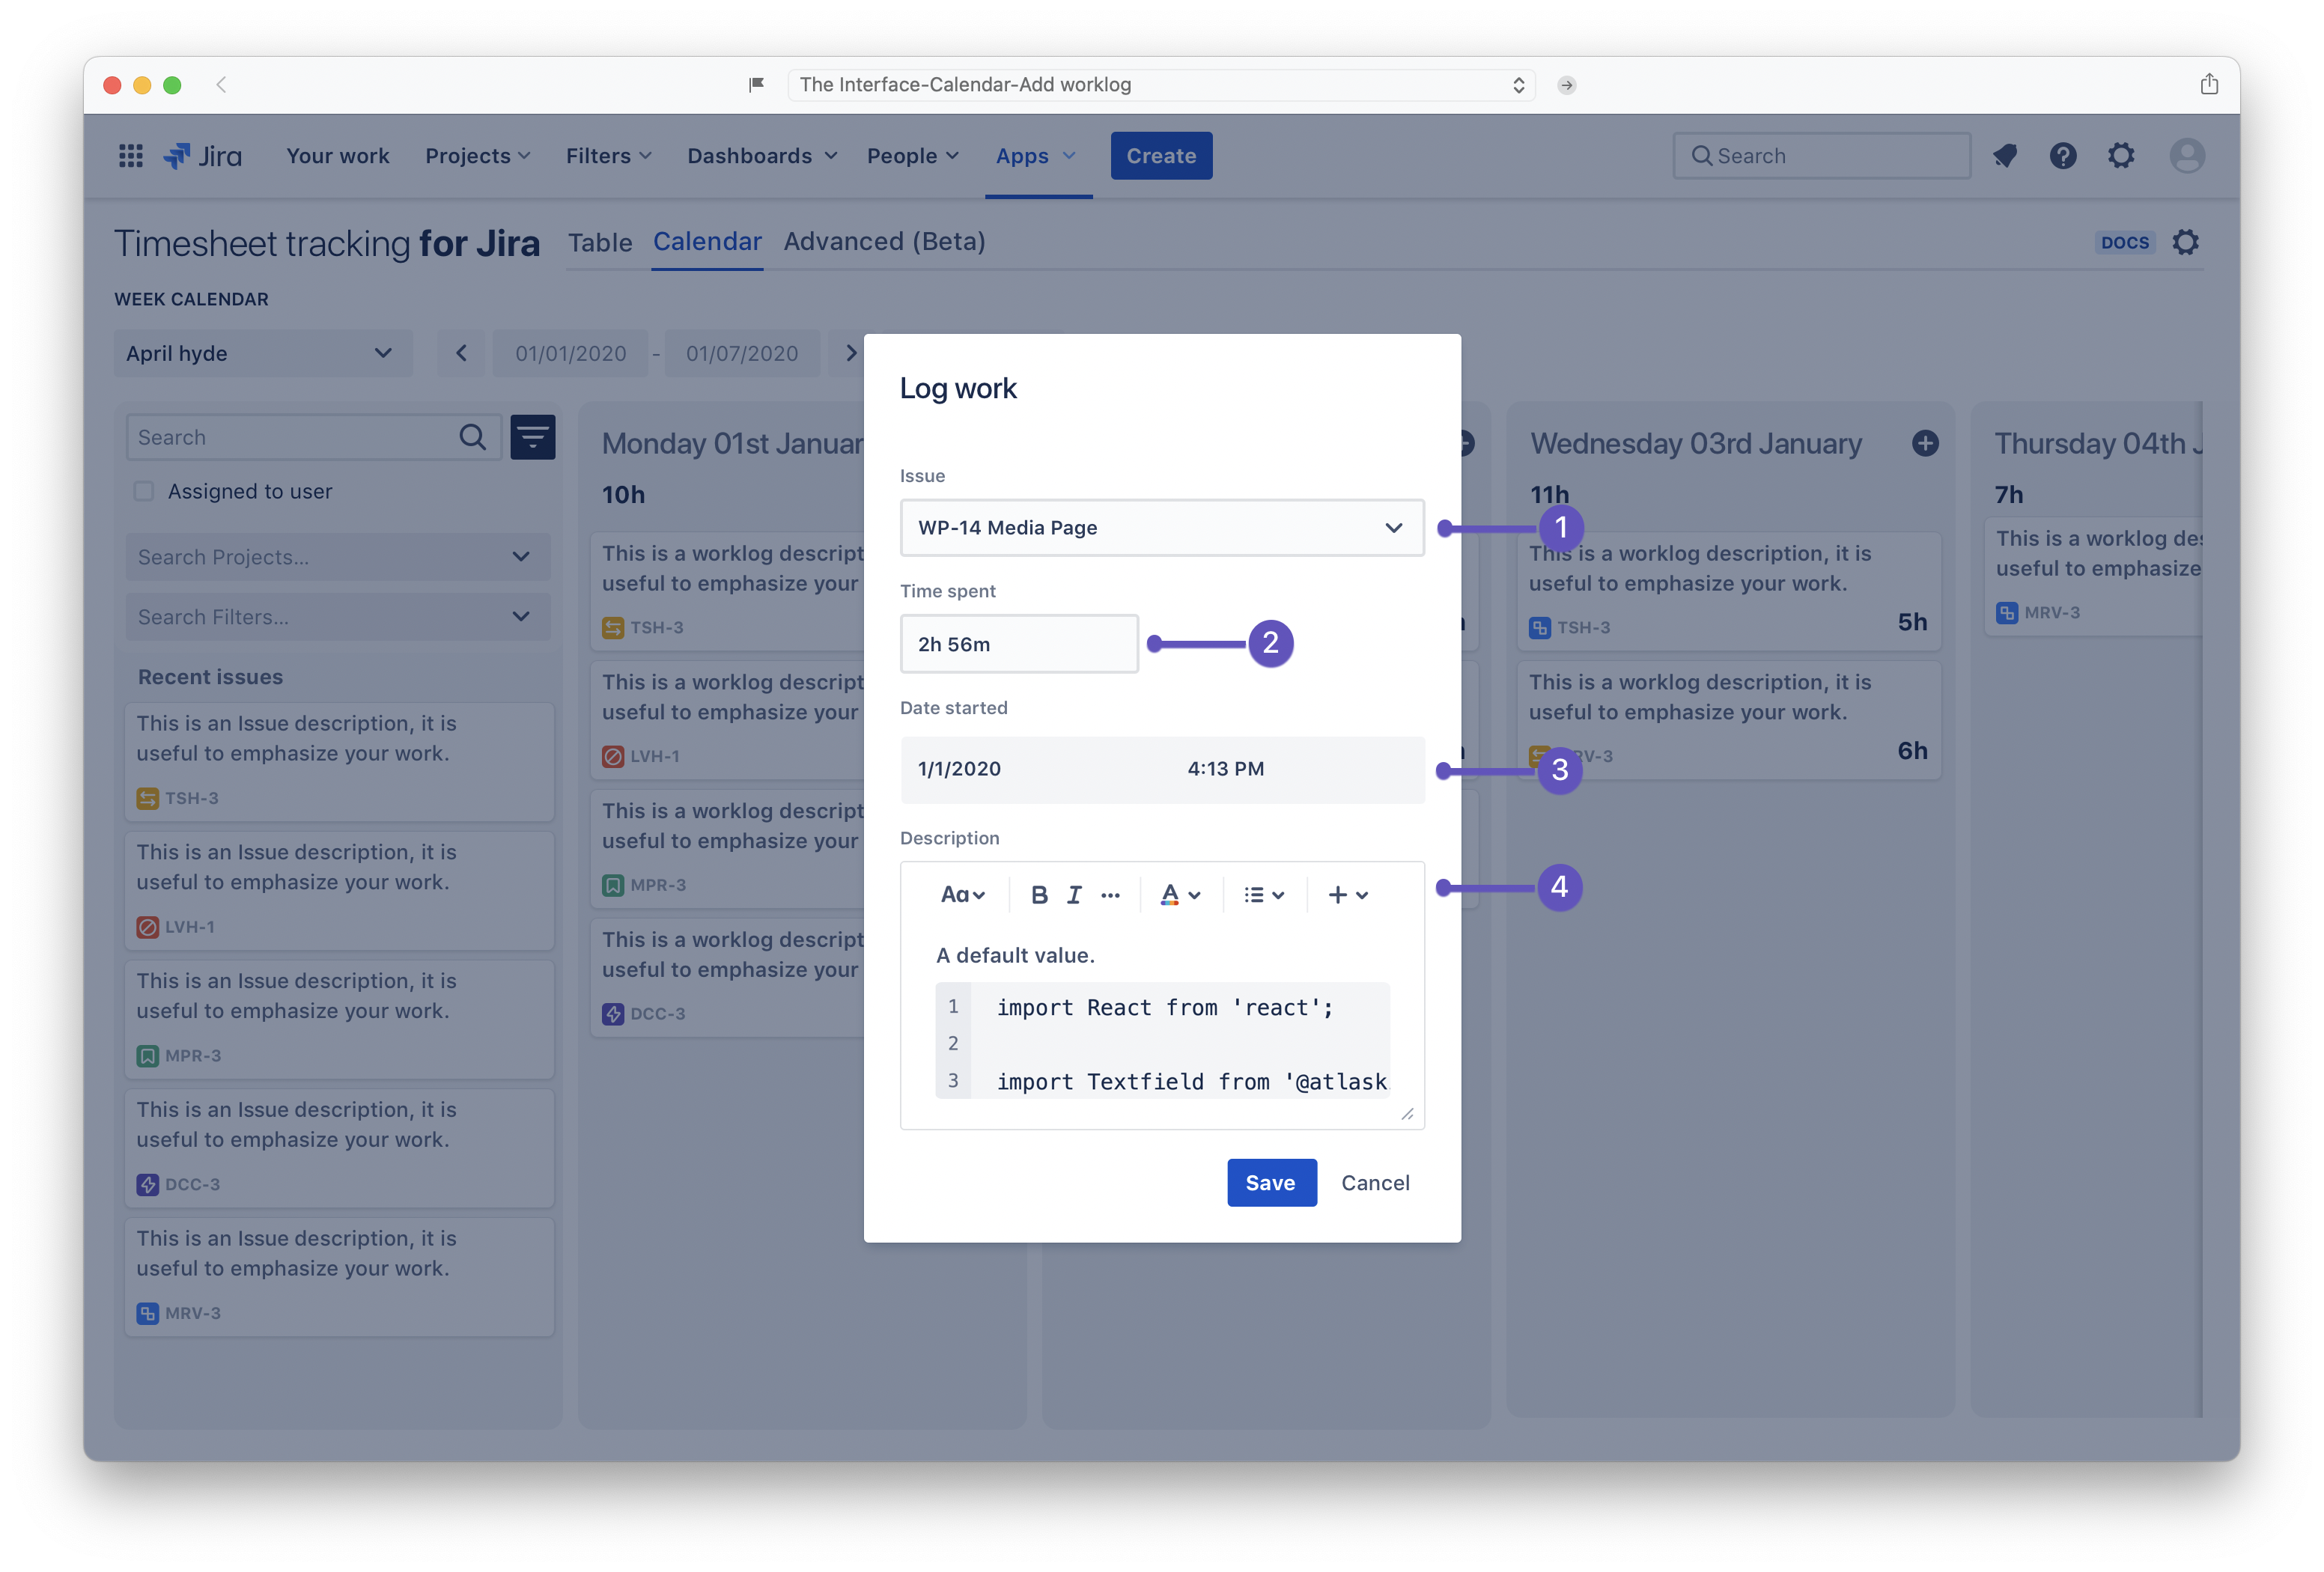
In Calendar, you can directly add/edit work log within the day column by clicking on the button “2. Add a worklog card”. When you do so, a modal will pop open as in the image above:
Issue input: This input allows you to whether search for an issue or select one in the scrolling menu.
Time spent input: Type in directly the time spent in a given task. w= weeks, d= days, h= hours, m= minutes. (keep it all in lowercase).
Date started input: This date picker allows you to enter the time of the beginning of the worklog. In the other hand, the date (mm/dd/yy) will still put and unchangeable since you clicked the column of the day in question.
Decription area input: You can emphasize your worklog by adding a description to it in this area.
Edit worklog
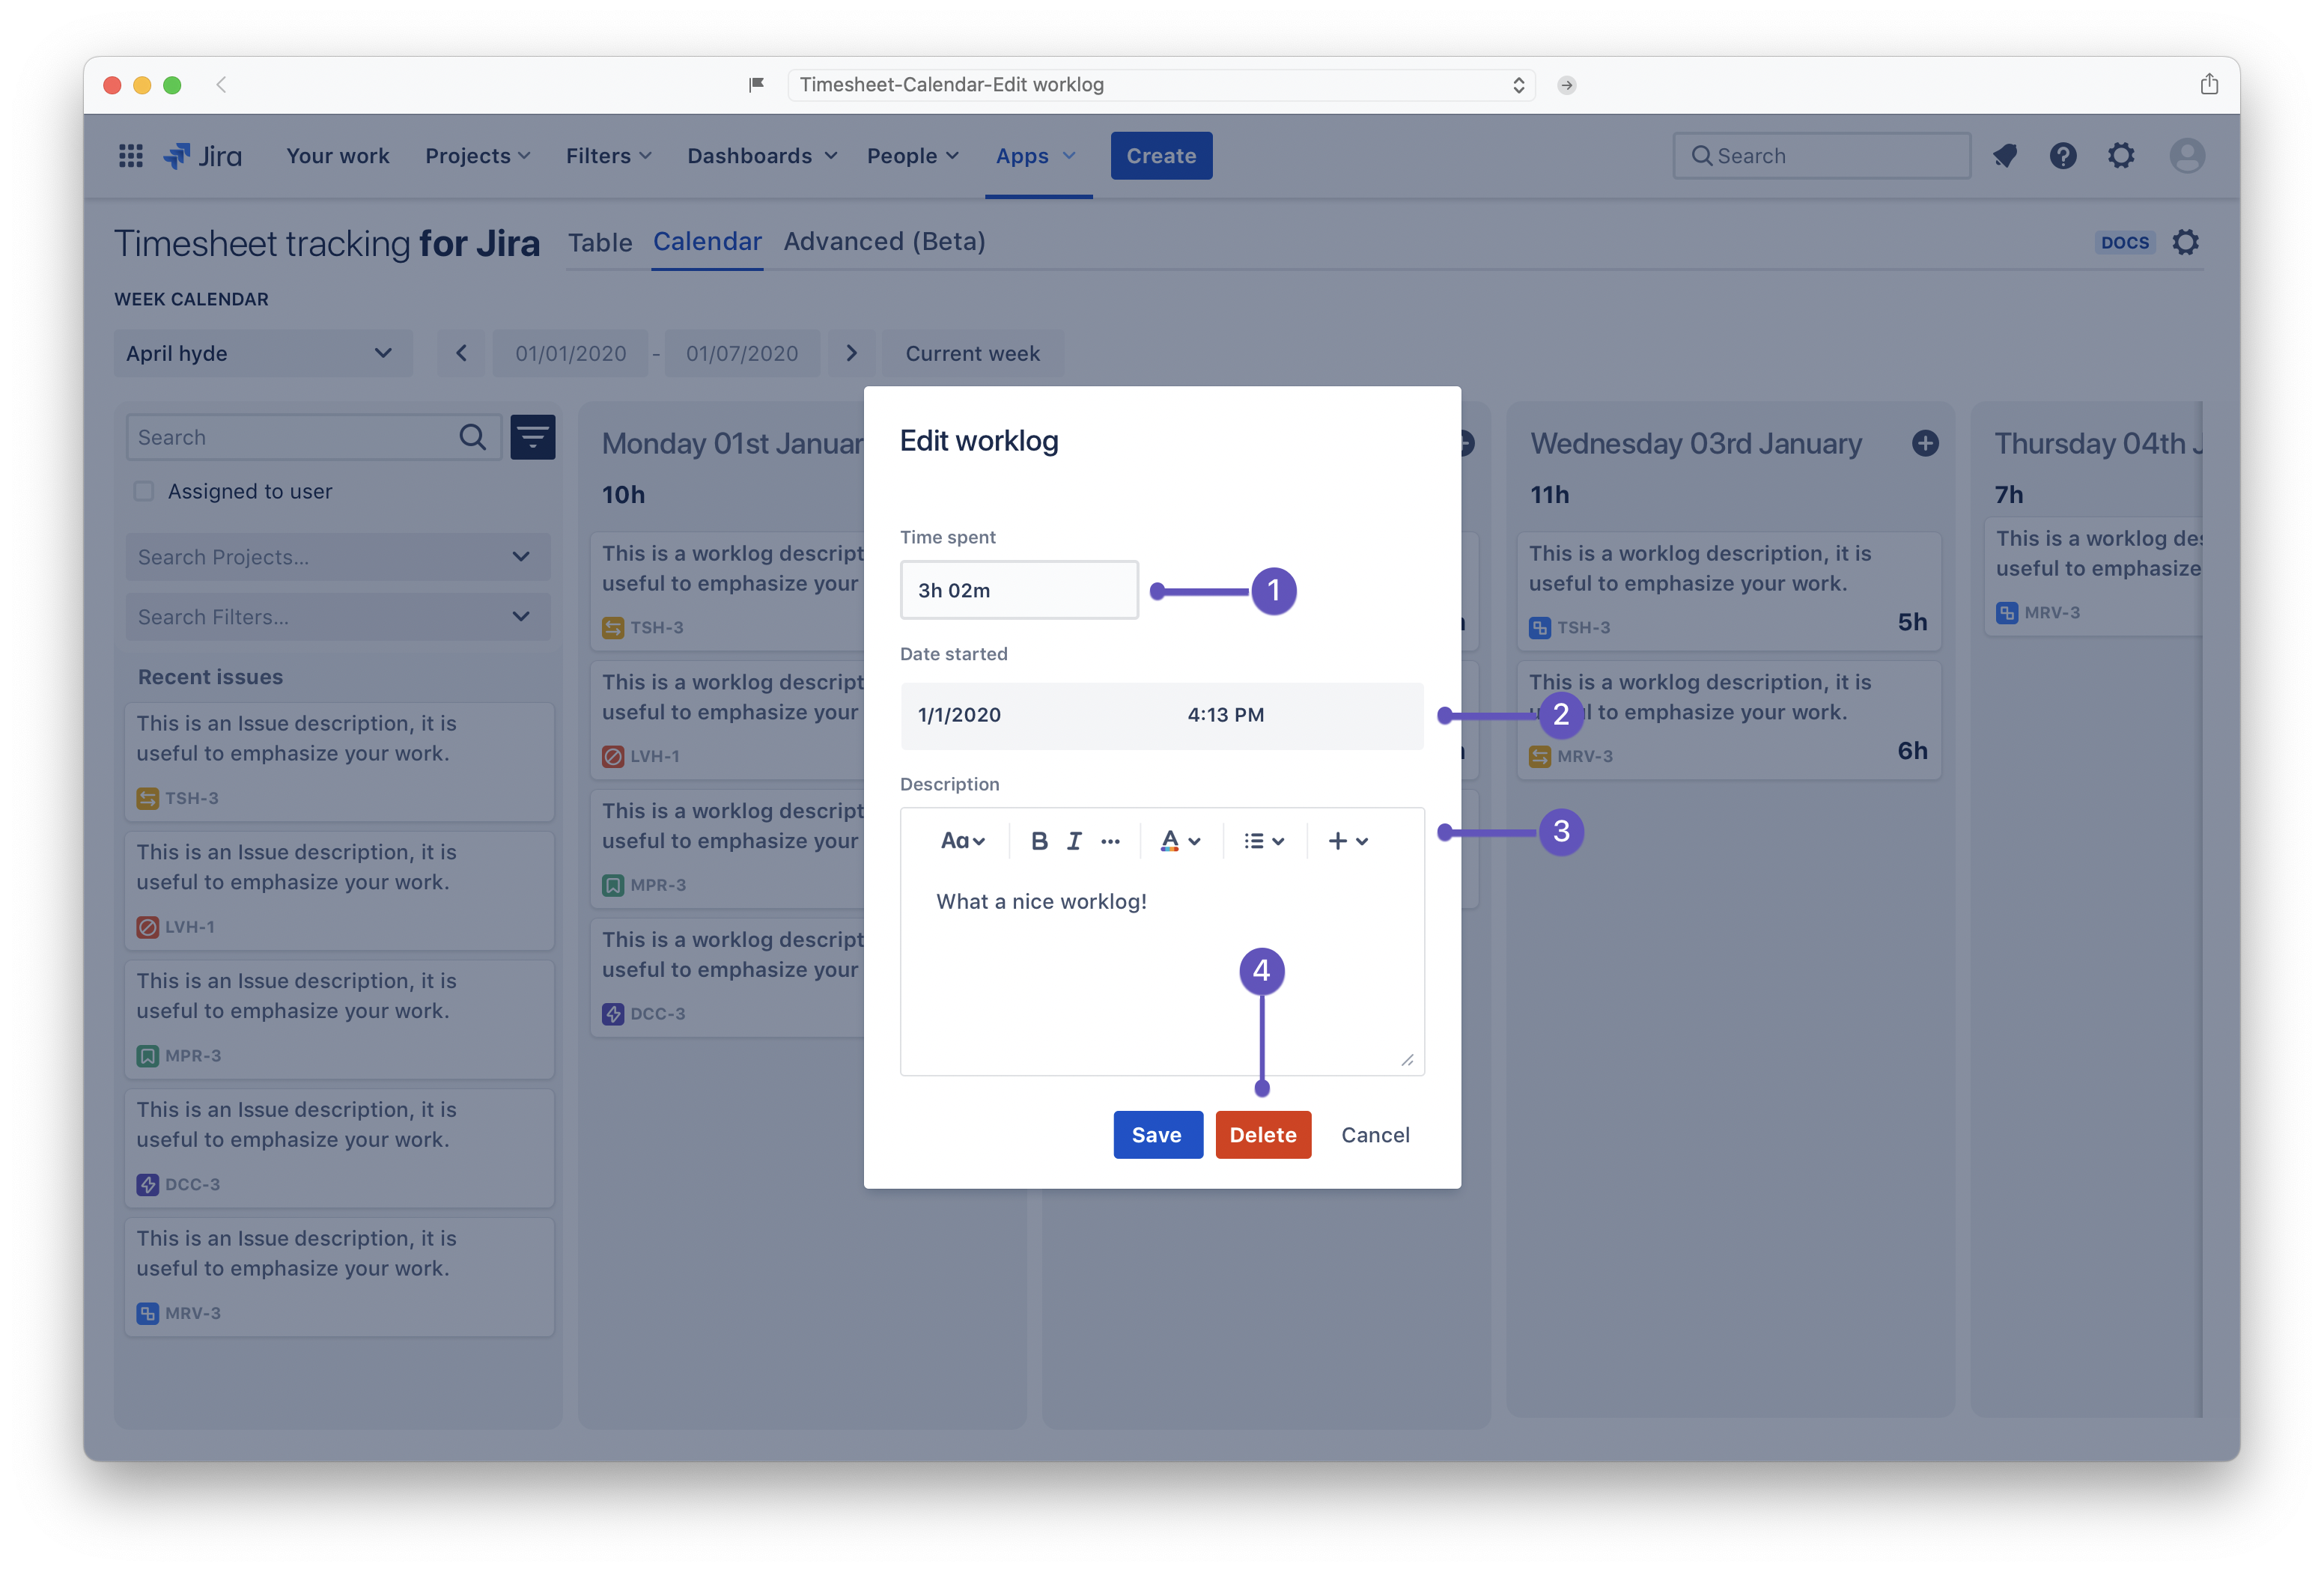
You can click on the ”3. Worklog card”, when you do so , a modal will pop open where you can edit the worklog in question.
Time spent input: Edit directly the time spent by typing in the input. w= weeks, d= days, h= hours, m= minutes. (keep it all in lowercase).
Date started input: This date picker allows you to edit the time of the beginning of the worklog. In the other hand, the date (mm/dd/yy) will still put and unchangeable since you clicked the column of the day in question.
Decription area input: You can emphasize your worklog by adding or editing the description to it in this area.